Conversion in progress ...
Please wait while we generate your PDF
Torrance 90505 Real Estate Market Report – February 2025
Understanding the Market
How to Read a Market Report
A market report is a snapshot of real estate trends in a specific area over a given time frame. It includes data like median sale prices, average days on market, and the number of homes sold. Here's how to make the most of the information:
Median Sale Price: This represents the middle point of all homes sold—half sold for more, half for less. It’s a great indicator of overall market trends.
Average Days on Market (DOM): This tells you how long properties typically stay on the market before selling. A shorter DOM indicates a more competitive market.
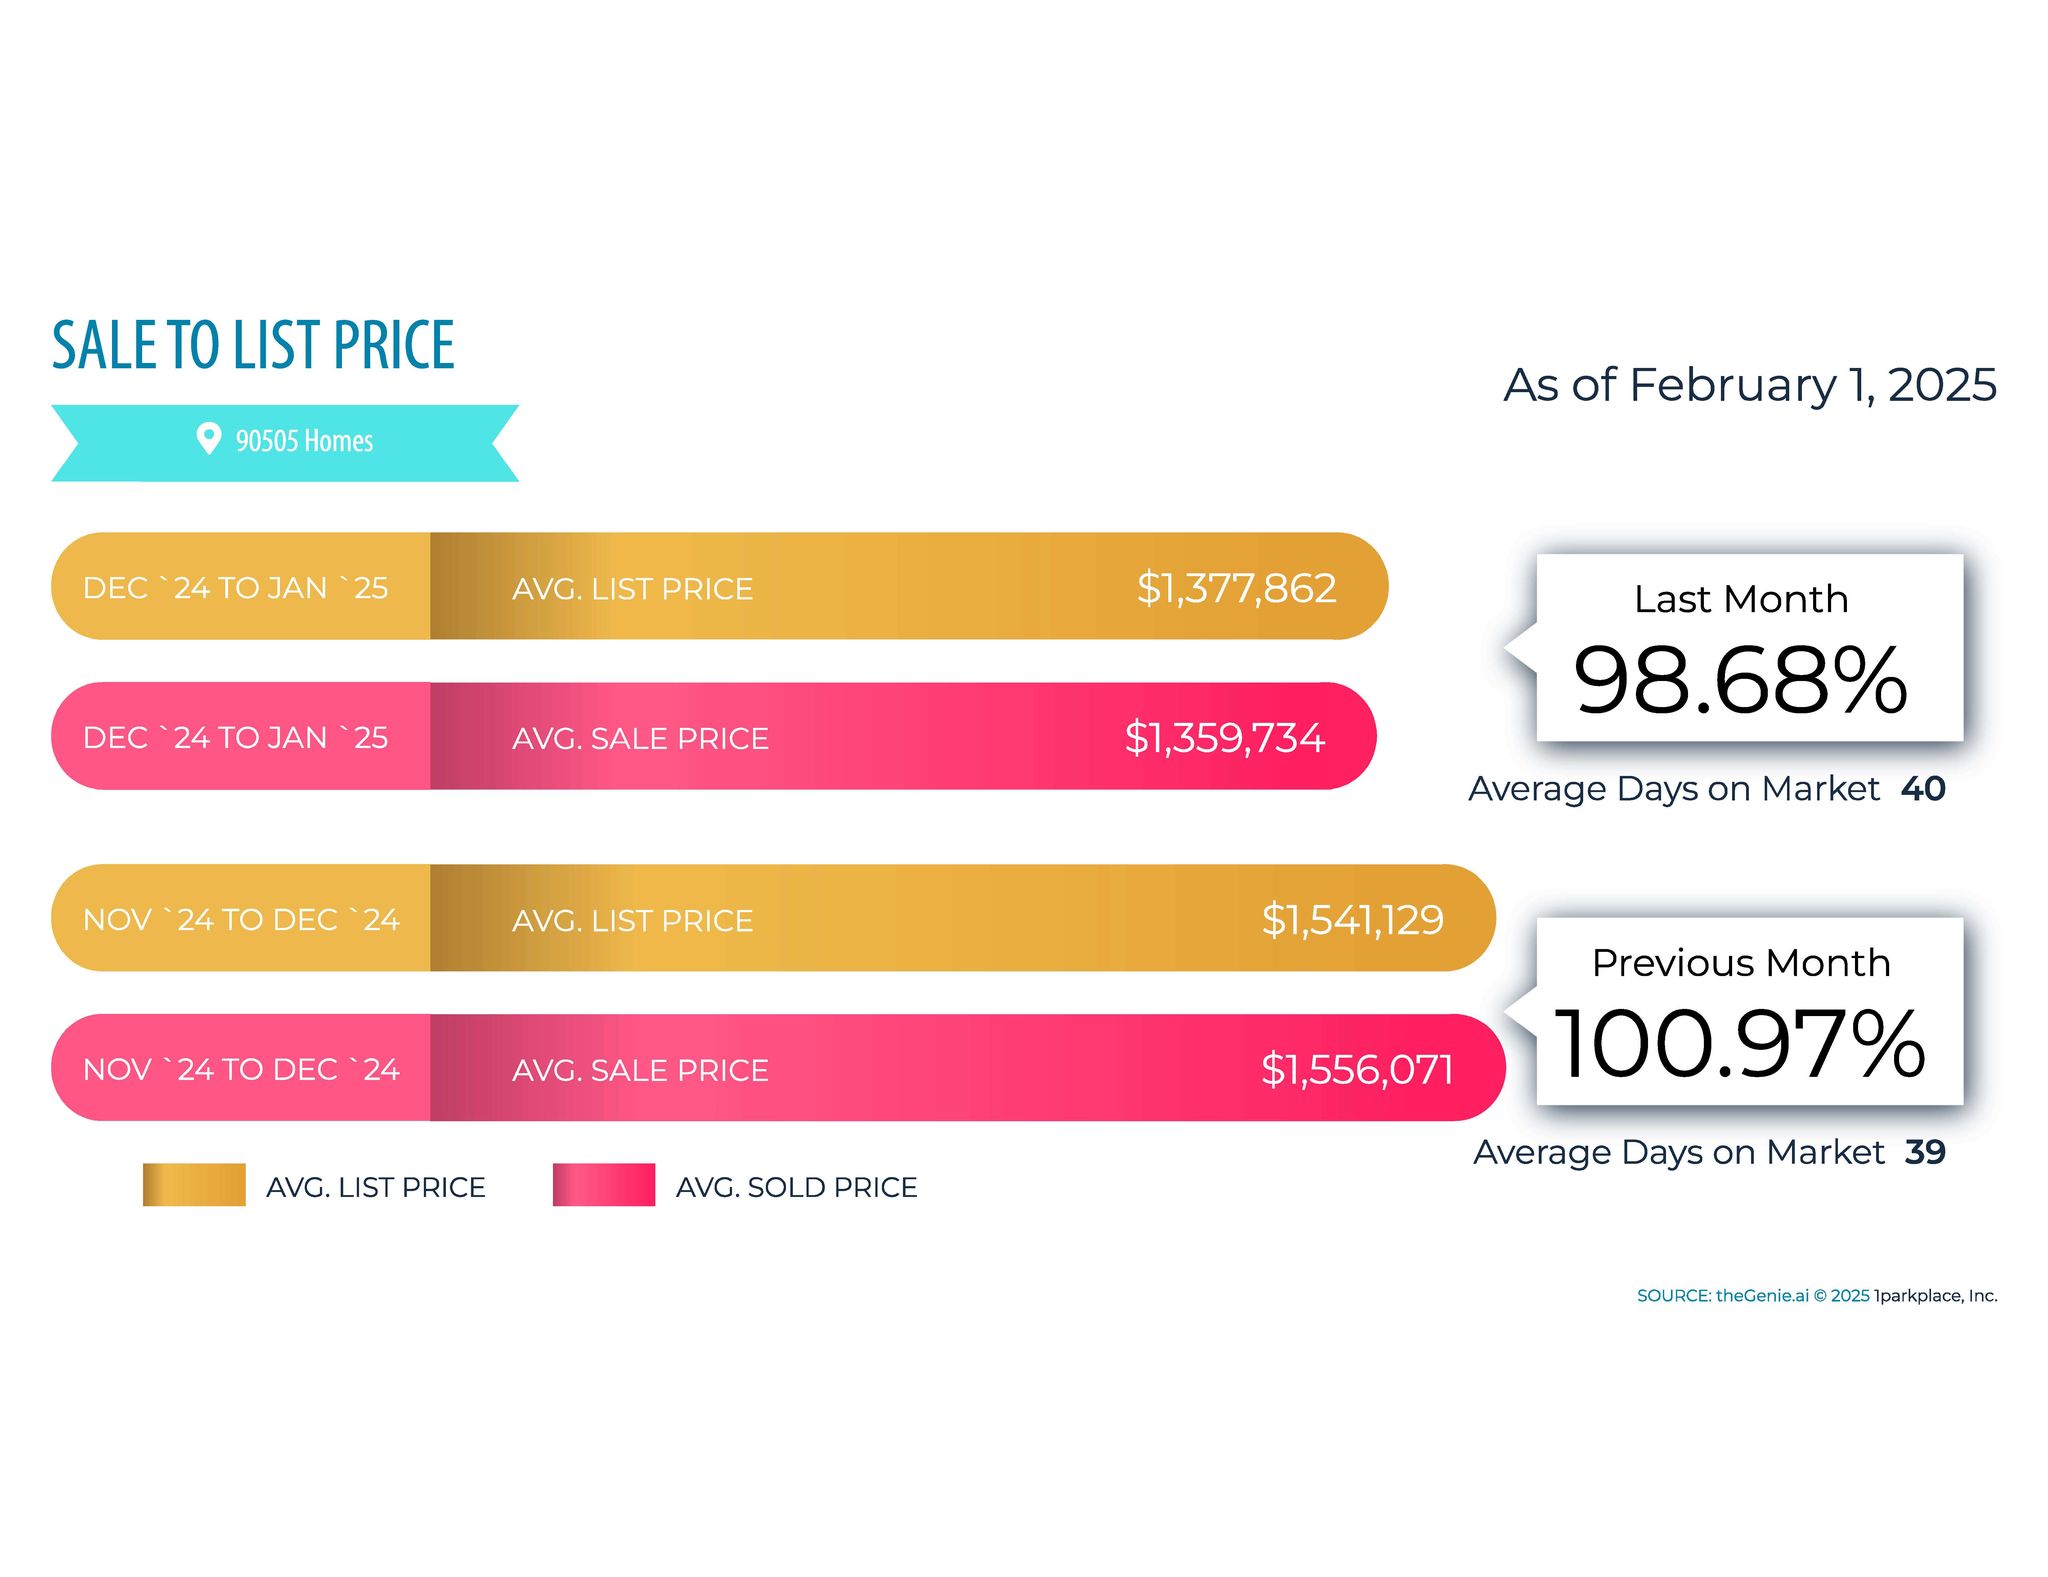
Sale-to-List Price Ratio: This percentage shows how closely homes are selling to their original asking price—a higher ratio suggests strong demand.
Turnover Rate: This measures how often homes in a community change hands, giving insight into the stability or activity level of the area.
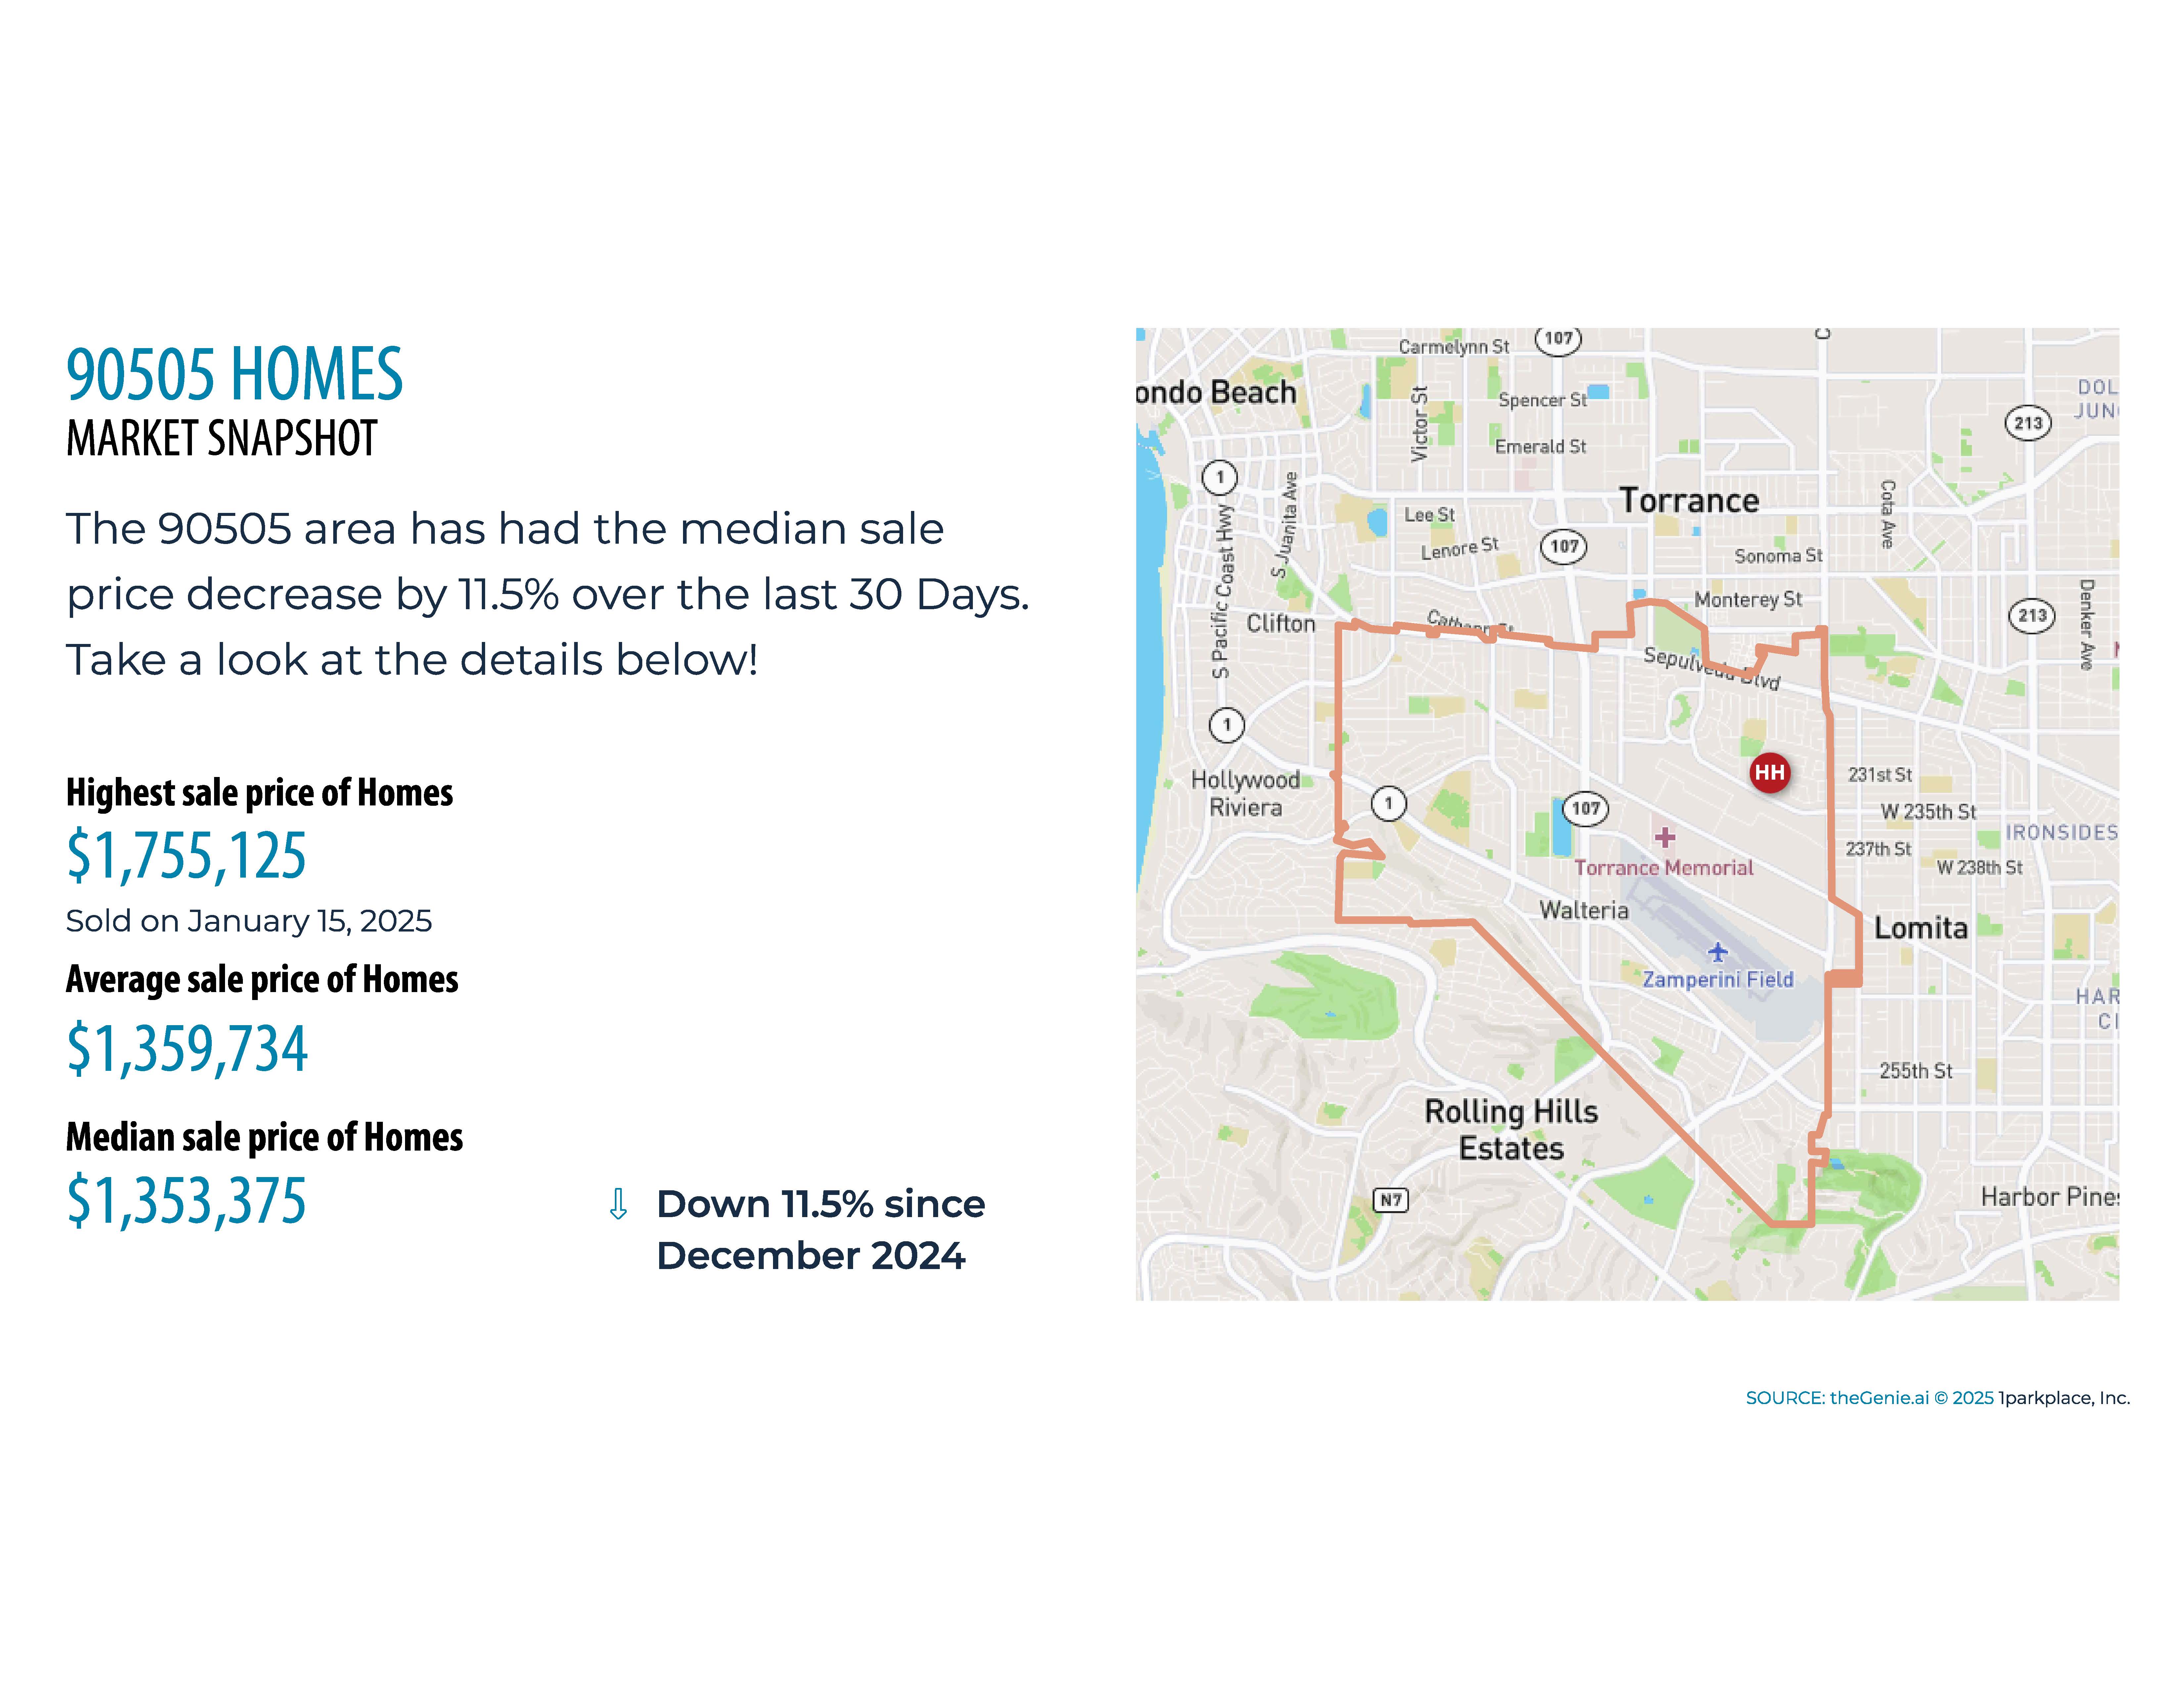
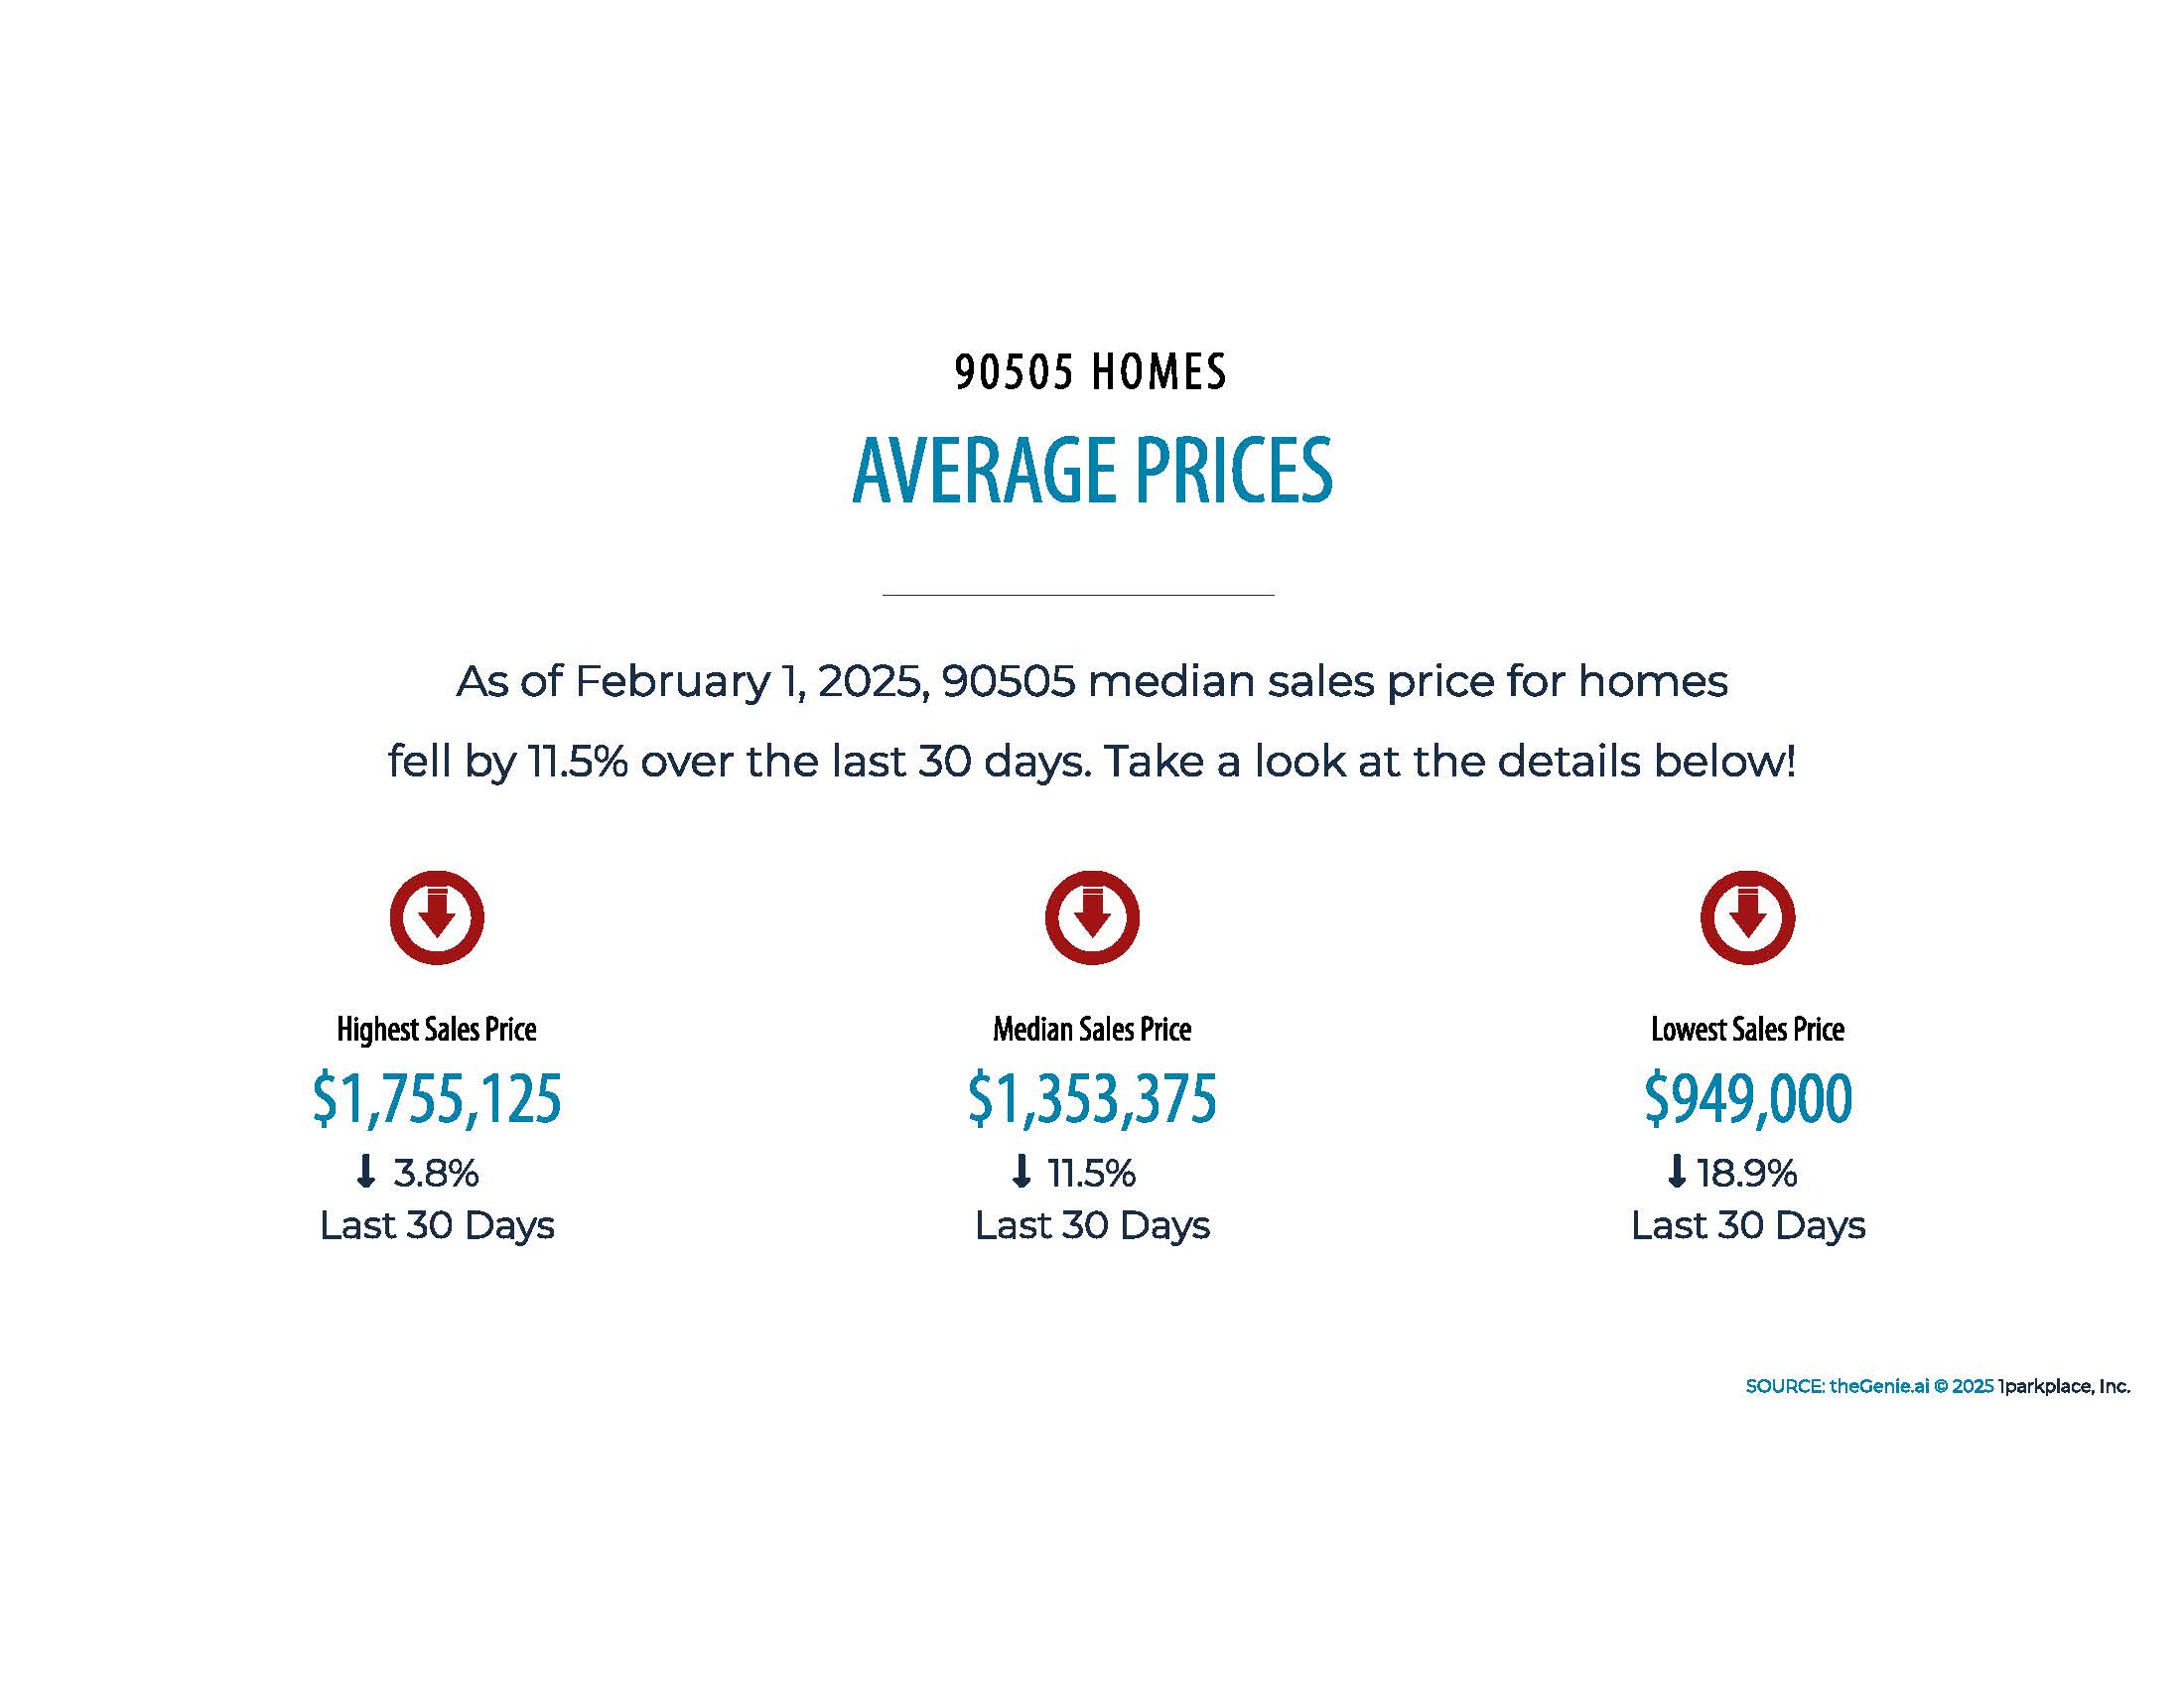
The slide above provides a high-level summary of recent real estate activity in the 90505 area or Torrance, CA. It highlights key pricing metrics, including the highest sale price of $1,755,125 (sold on January 15, 2025), the average sale price of $1,359,734, and the median sale price of $1,353,375, which reflects an 11.5% decrease over the past 30 days. This snapshot is ideal for quickly understanding the overall performance of the local real estate market.
Many sellers have discovered that immersing themselves in current market data gives them a powerful glimpse into the future of their home equity. By analyzing local real estate trends, you can anticipate shifts in buyer preferences, pricing fluctuations, and demand patterns. This knowledge empowers you to make proactive, informed decisions about when to list, make a purchase, or adjust pricing strategy.
So, how do you become a market research pro? Start by tracking key metrics like median sale prices, days on market, and inventory levels in your area. Look for patterns and changes over time. Are prices creeping up or dipping down? Is inventory tight or plentiful? These insights will help you gauge the temperature of your local market.
Next, dive into the details of recently sold homes similar to yours. Note their features, upgrades, and final sale prices. This will give you a realistic benchmark for your own home's value or help determine when it's a good time to buy. Don’t forget to factor in any unique selling points that could command a premium price, like sought-after home features or rare amenities.
Staying on top of market forecasts is also crucial. Keep an eye out for economic indicators, demographic shifts, and development projects that could impact your area’s desirability. For example, new infrastructure or commercial developments can drive up property values.
Luckily, you don’t have to navigate this data deluge alone. Tap into our team’s nuanced expertise in local real estate. We have our finger on the pulse of your market. We offer free, no-obligation comparative market analyses to help you pinpoint your home's optimal price.
There are also plenty of online tools and resources to keep you in the know.
Follow our real estate blogs for the latest local buzz!
Why Is Hyper-Local Data More Important Than National Real Estate News?
While national real estate news can provide a broad overview of market trends, real estate is inherently local. Hyper-local data from a market report is far more relevant and impactful because it reflects what’s happening in your specific neighborhood or area. Here’s why:
Local Trends Vary Widely: Real estate markets can differ dramatically even between neighborhoods in the same city. For example, while national headlines might talk about a market “cooling,” Palos Verdes Estates might still be seeing strong demand and rising prices, as reflected in its 6.7% increase in median sale price over the past year.
Accurate Pricing: National averages don’t account for the unique features and conditions of your neighborhood. A hyper-local market report provides accurate data on home prices, days on market, and sale-to-list price ratios for your area, ensuring that buyers and sellers can make informed decisions based on real numbers.
Inventory and Competition Levels: The number of active listings and pending sales can reveal whether your neighborhood is a buyer’s or seller’s market. These local insights are critical for setting a competitive price or crafting a winning offer.
Insights on Neighborhood Desirability: Hyper-local data considers factors like nearby schools, amenities, and recent development projects that national news can’t address. These factors directly influence demand and pricing in your specific area.
Tailored Strategies for Success: By reviewing local data, your Realtor can craft strategies that are aligned with current trends in your neighborhood. Whether it’s pricing your home correctly or making a competitive offer, hyper-local data allows for precision that national news simply can’t provide.
In summary, while national headlines might grab attention, the details that matter most to you—whether you're buying, selling, or investing—are found in your neighborhood’s market report.
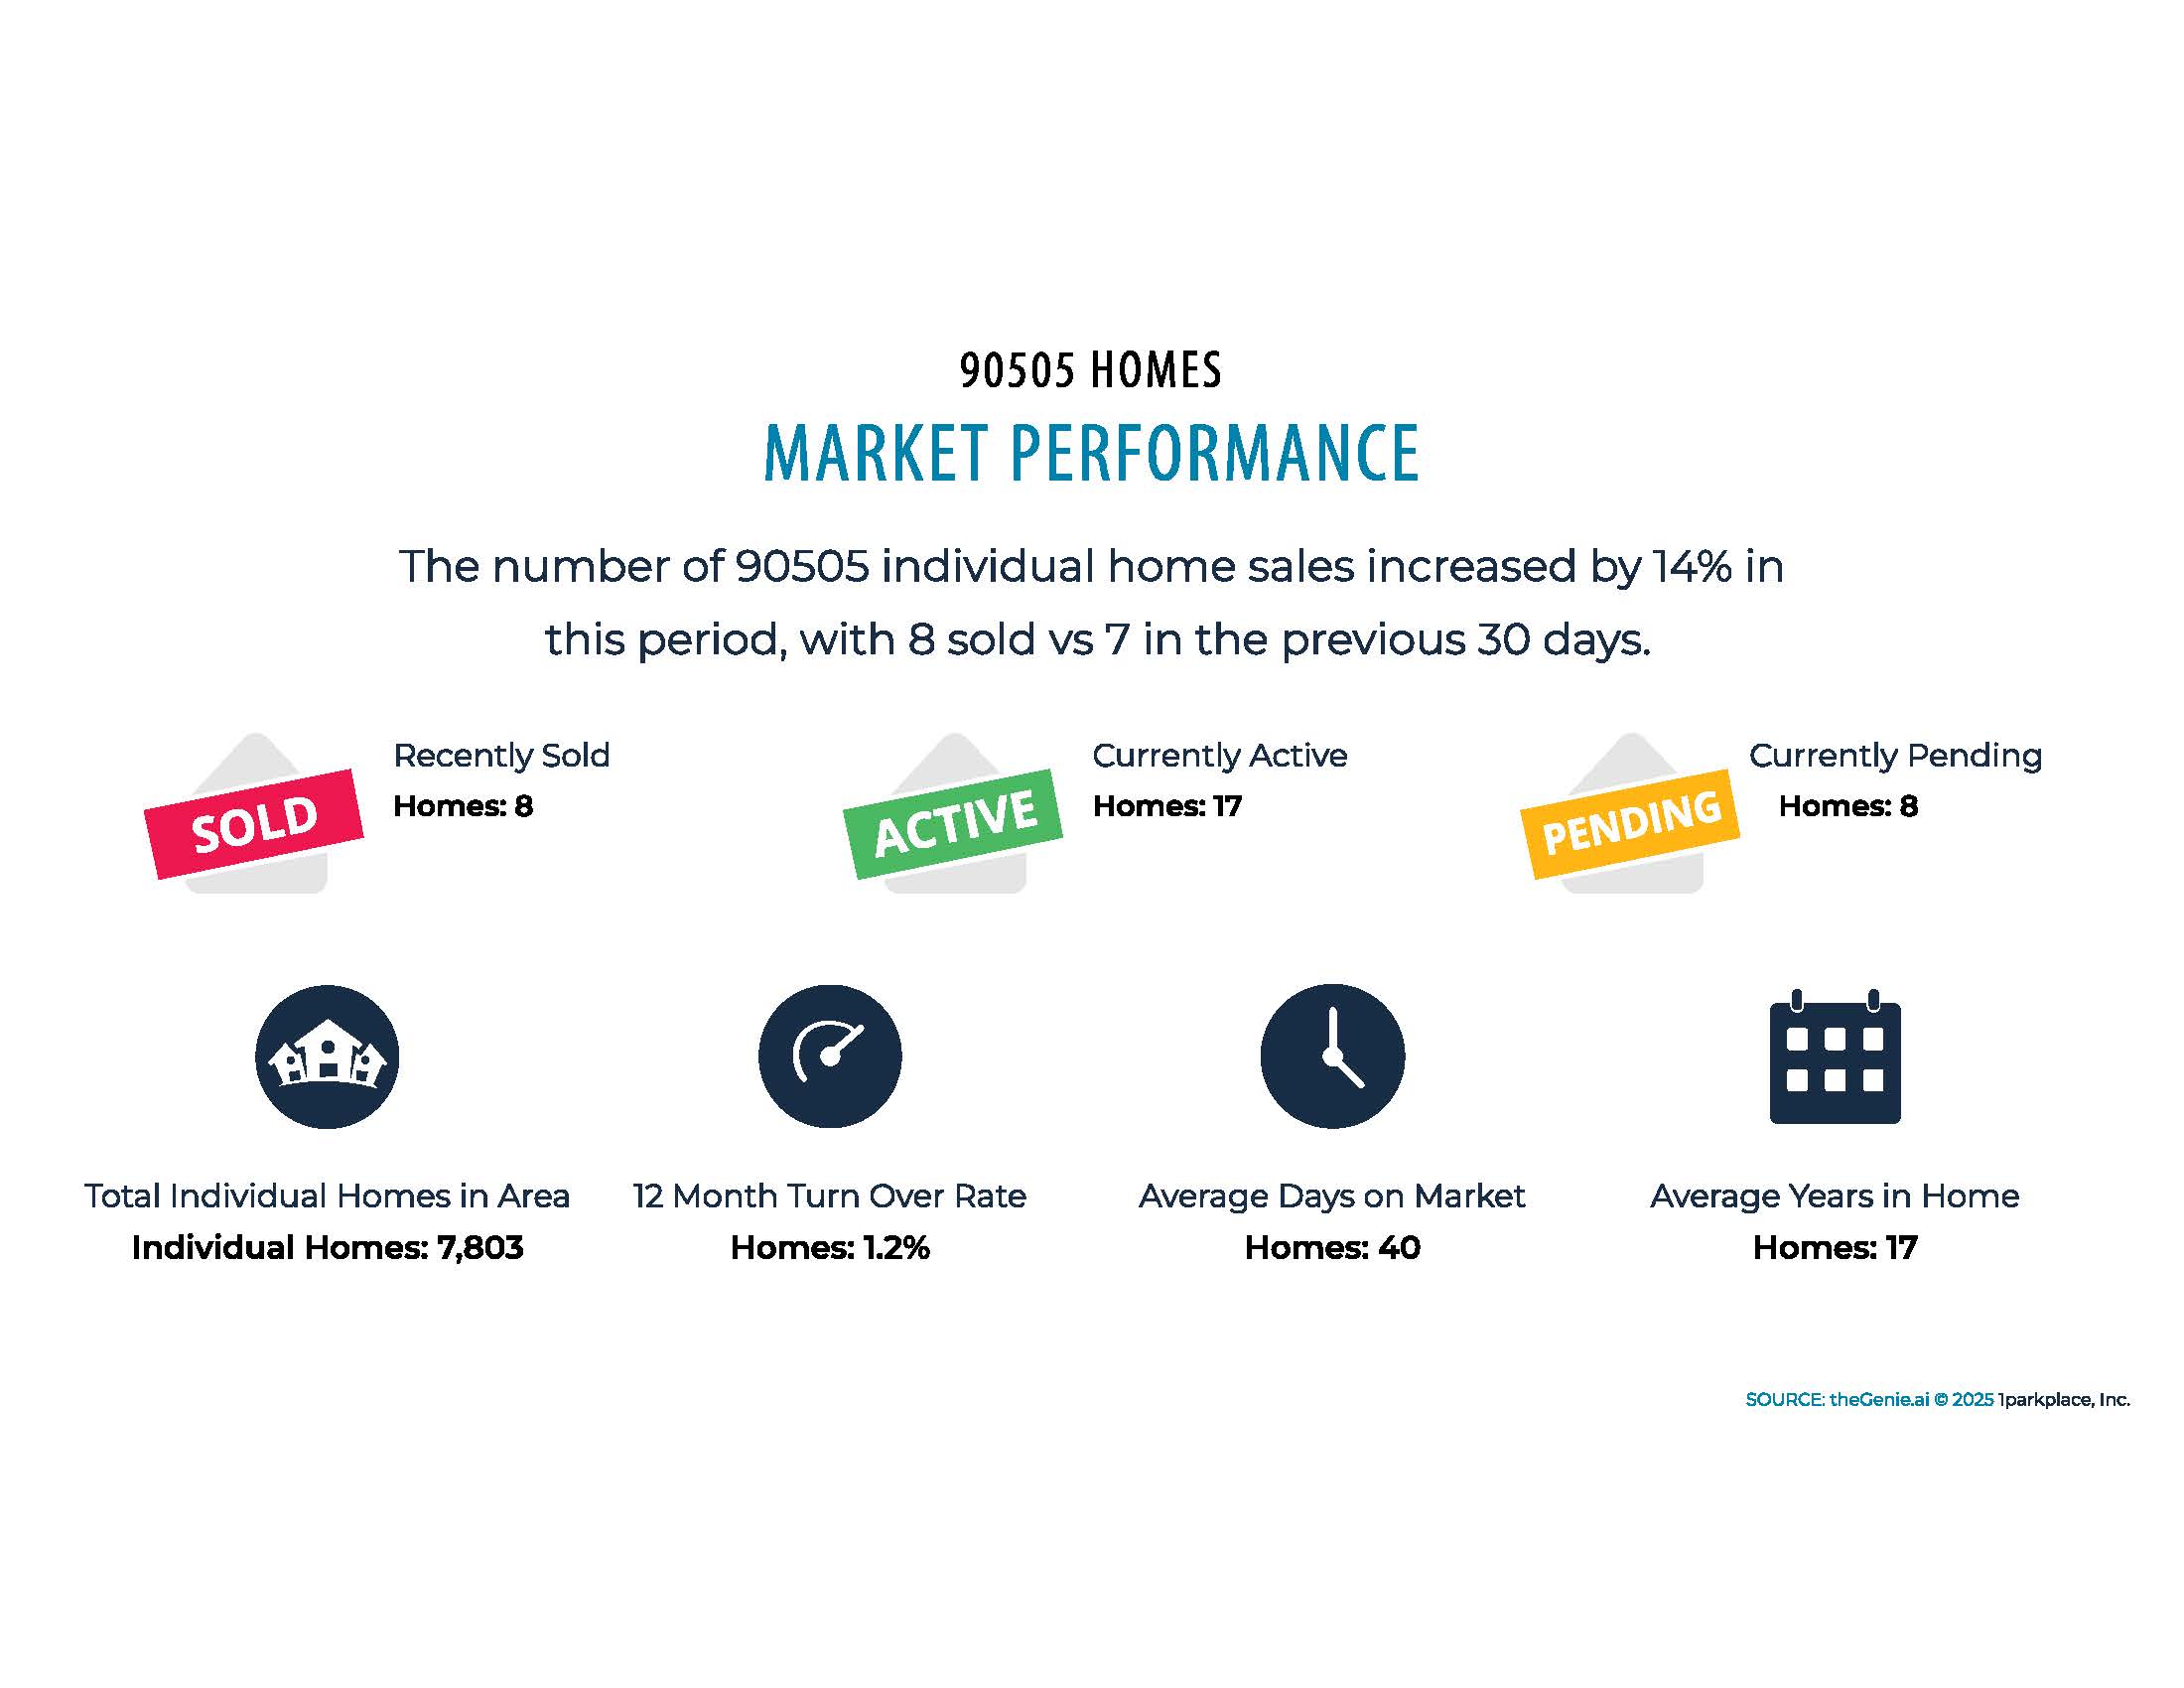
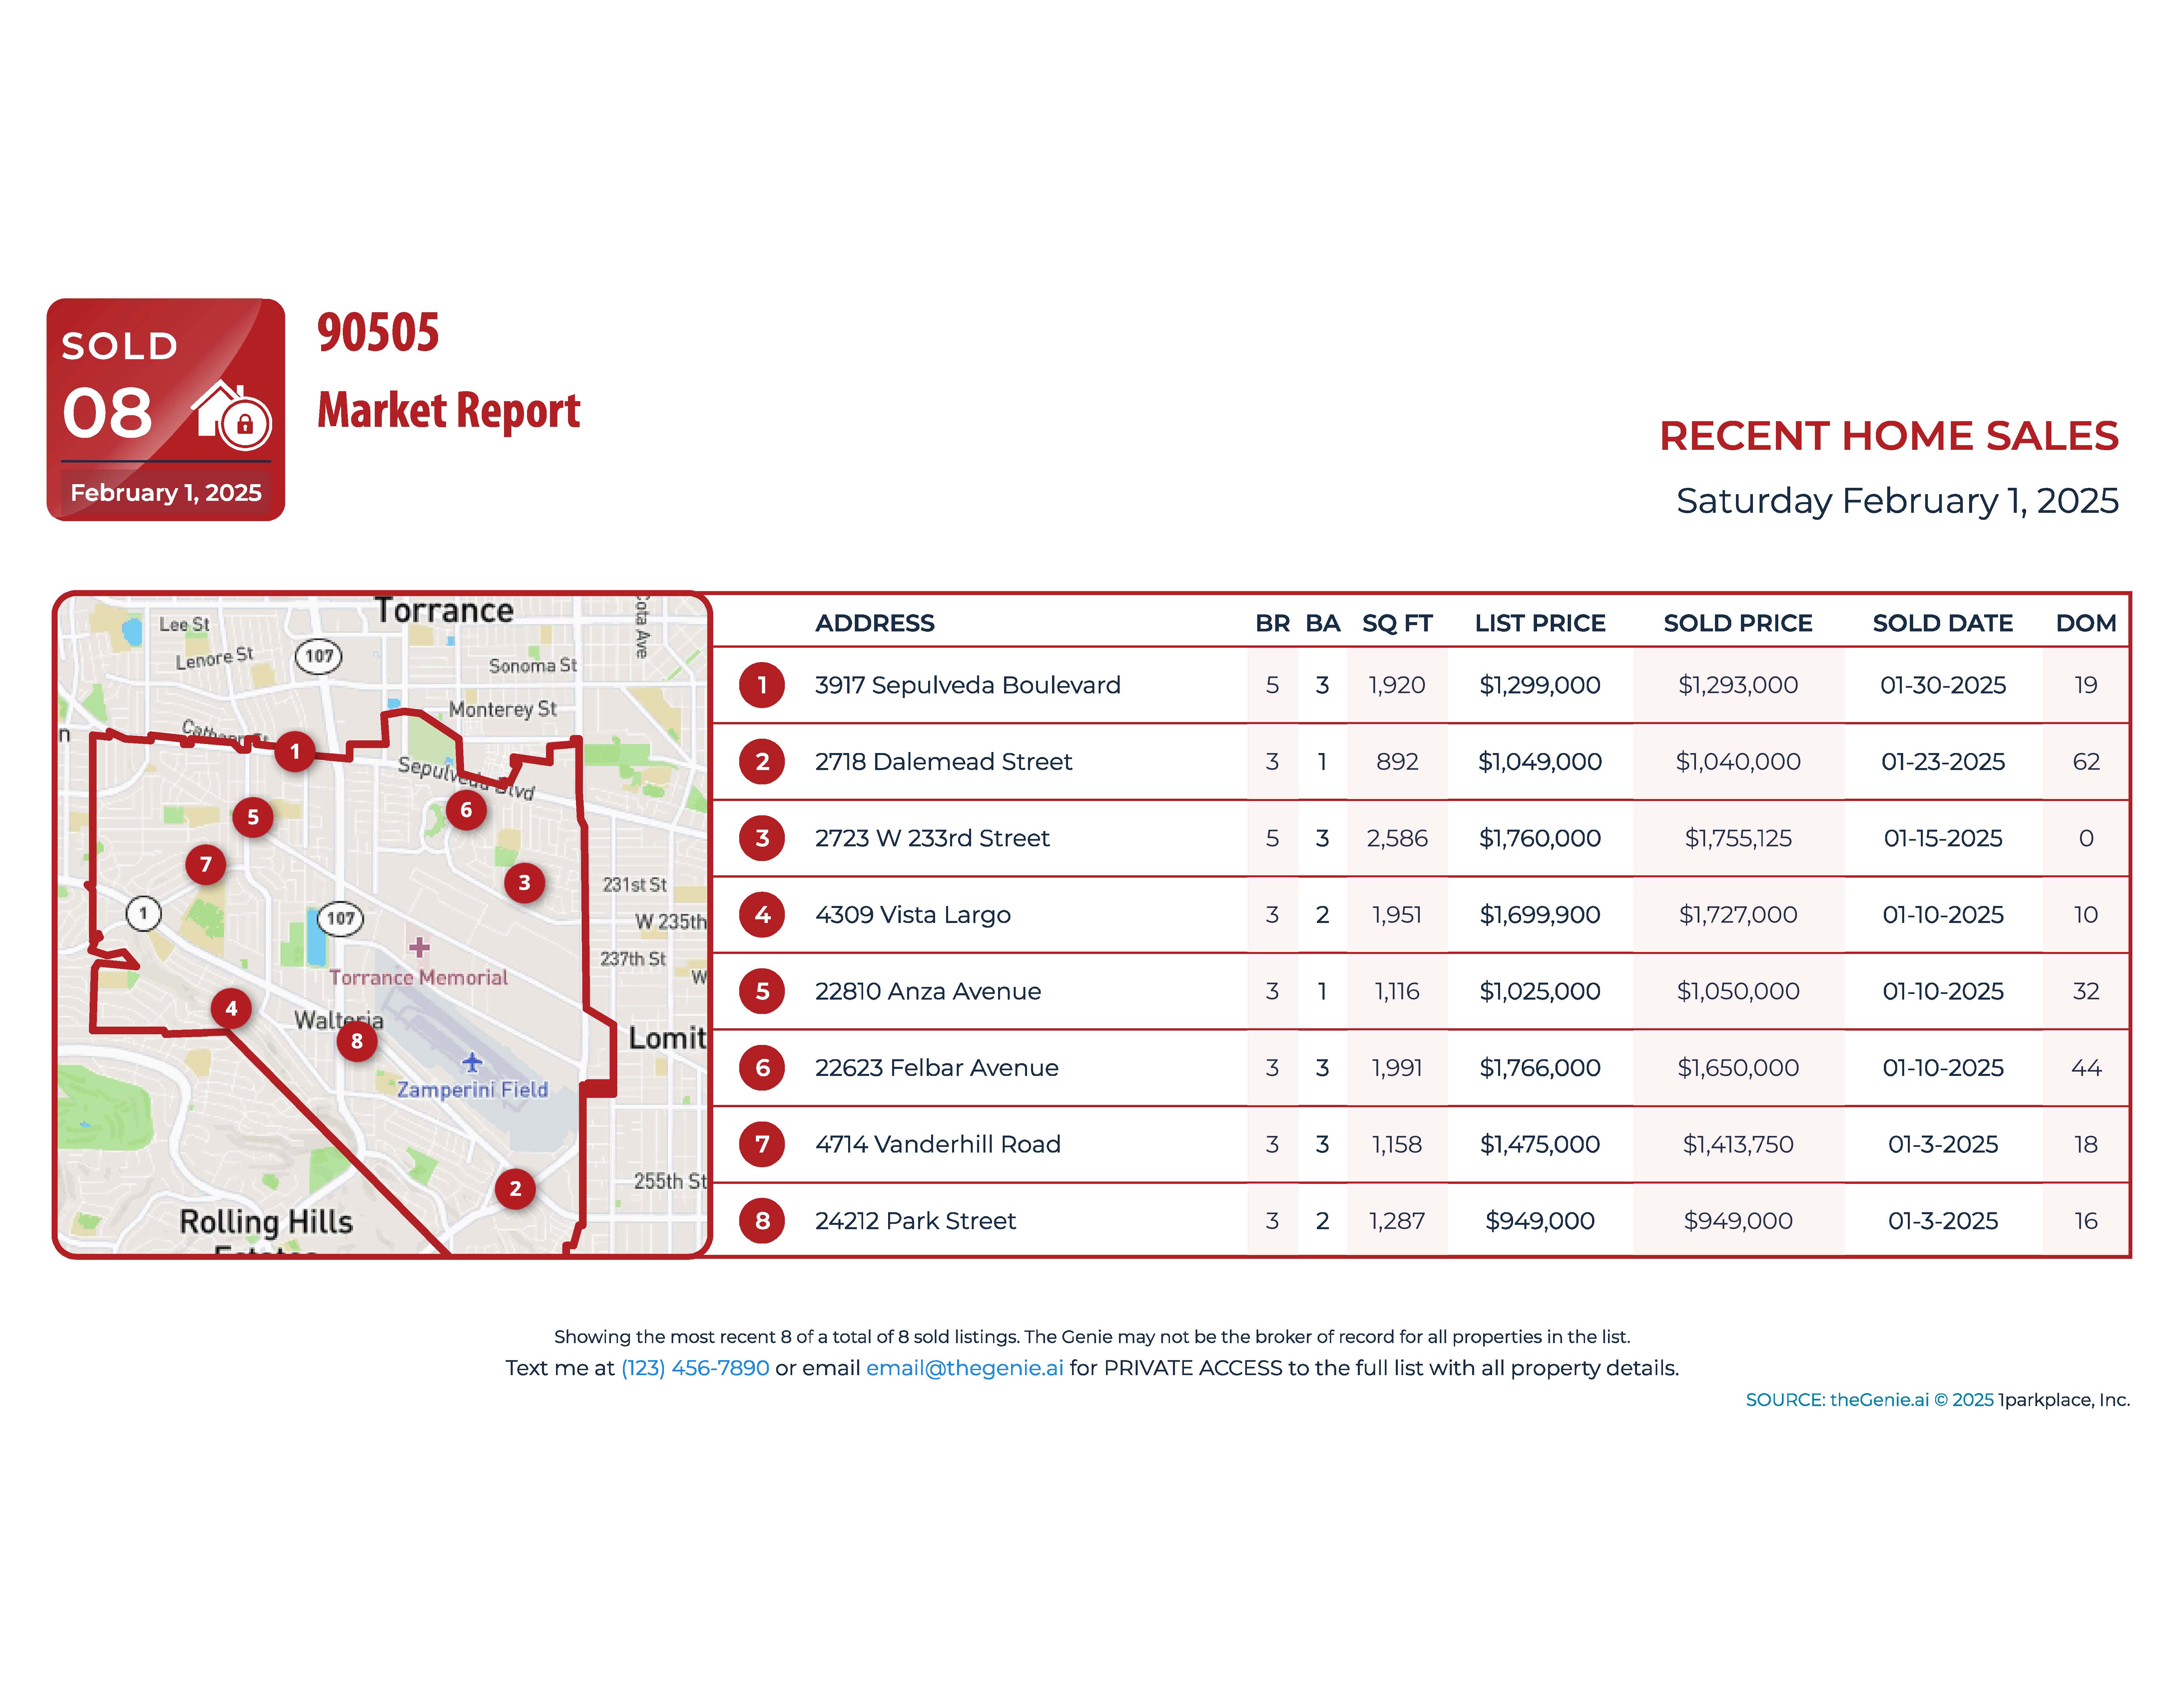
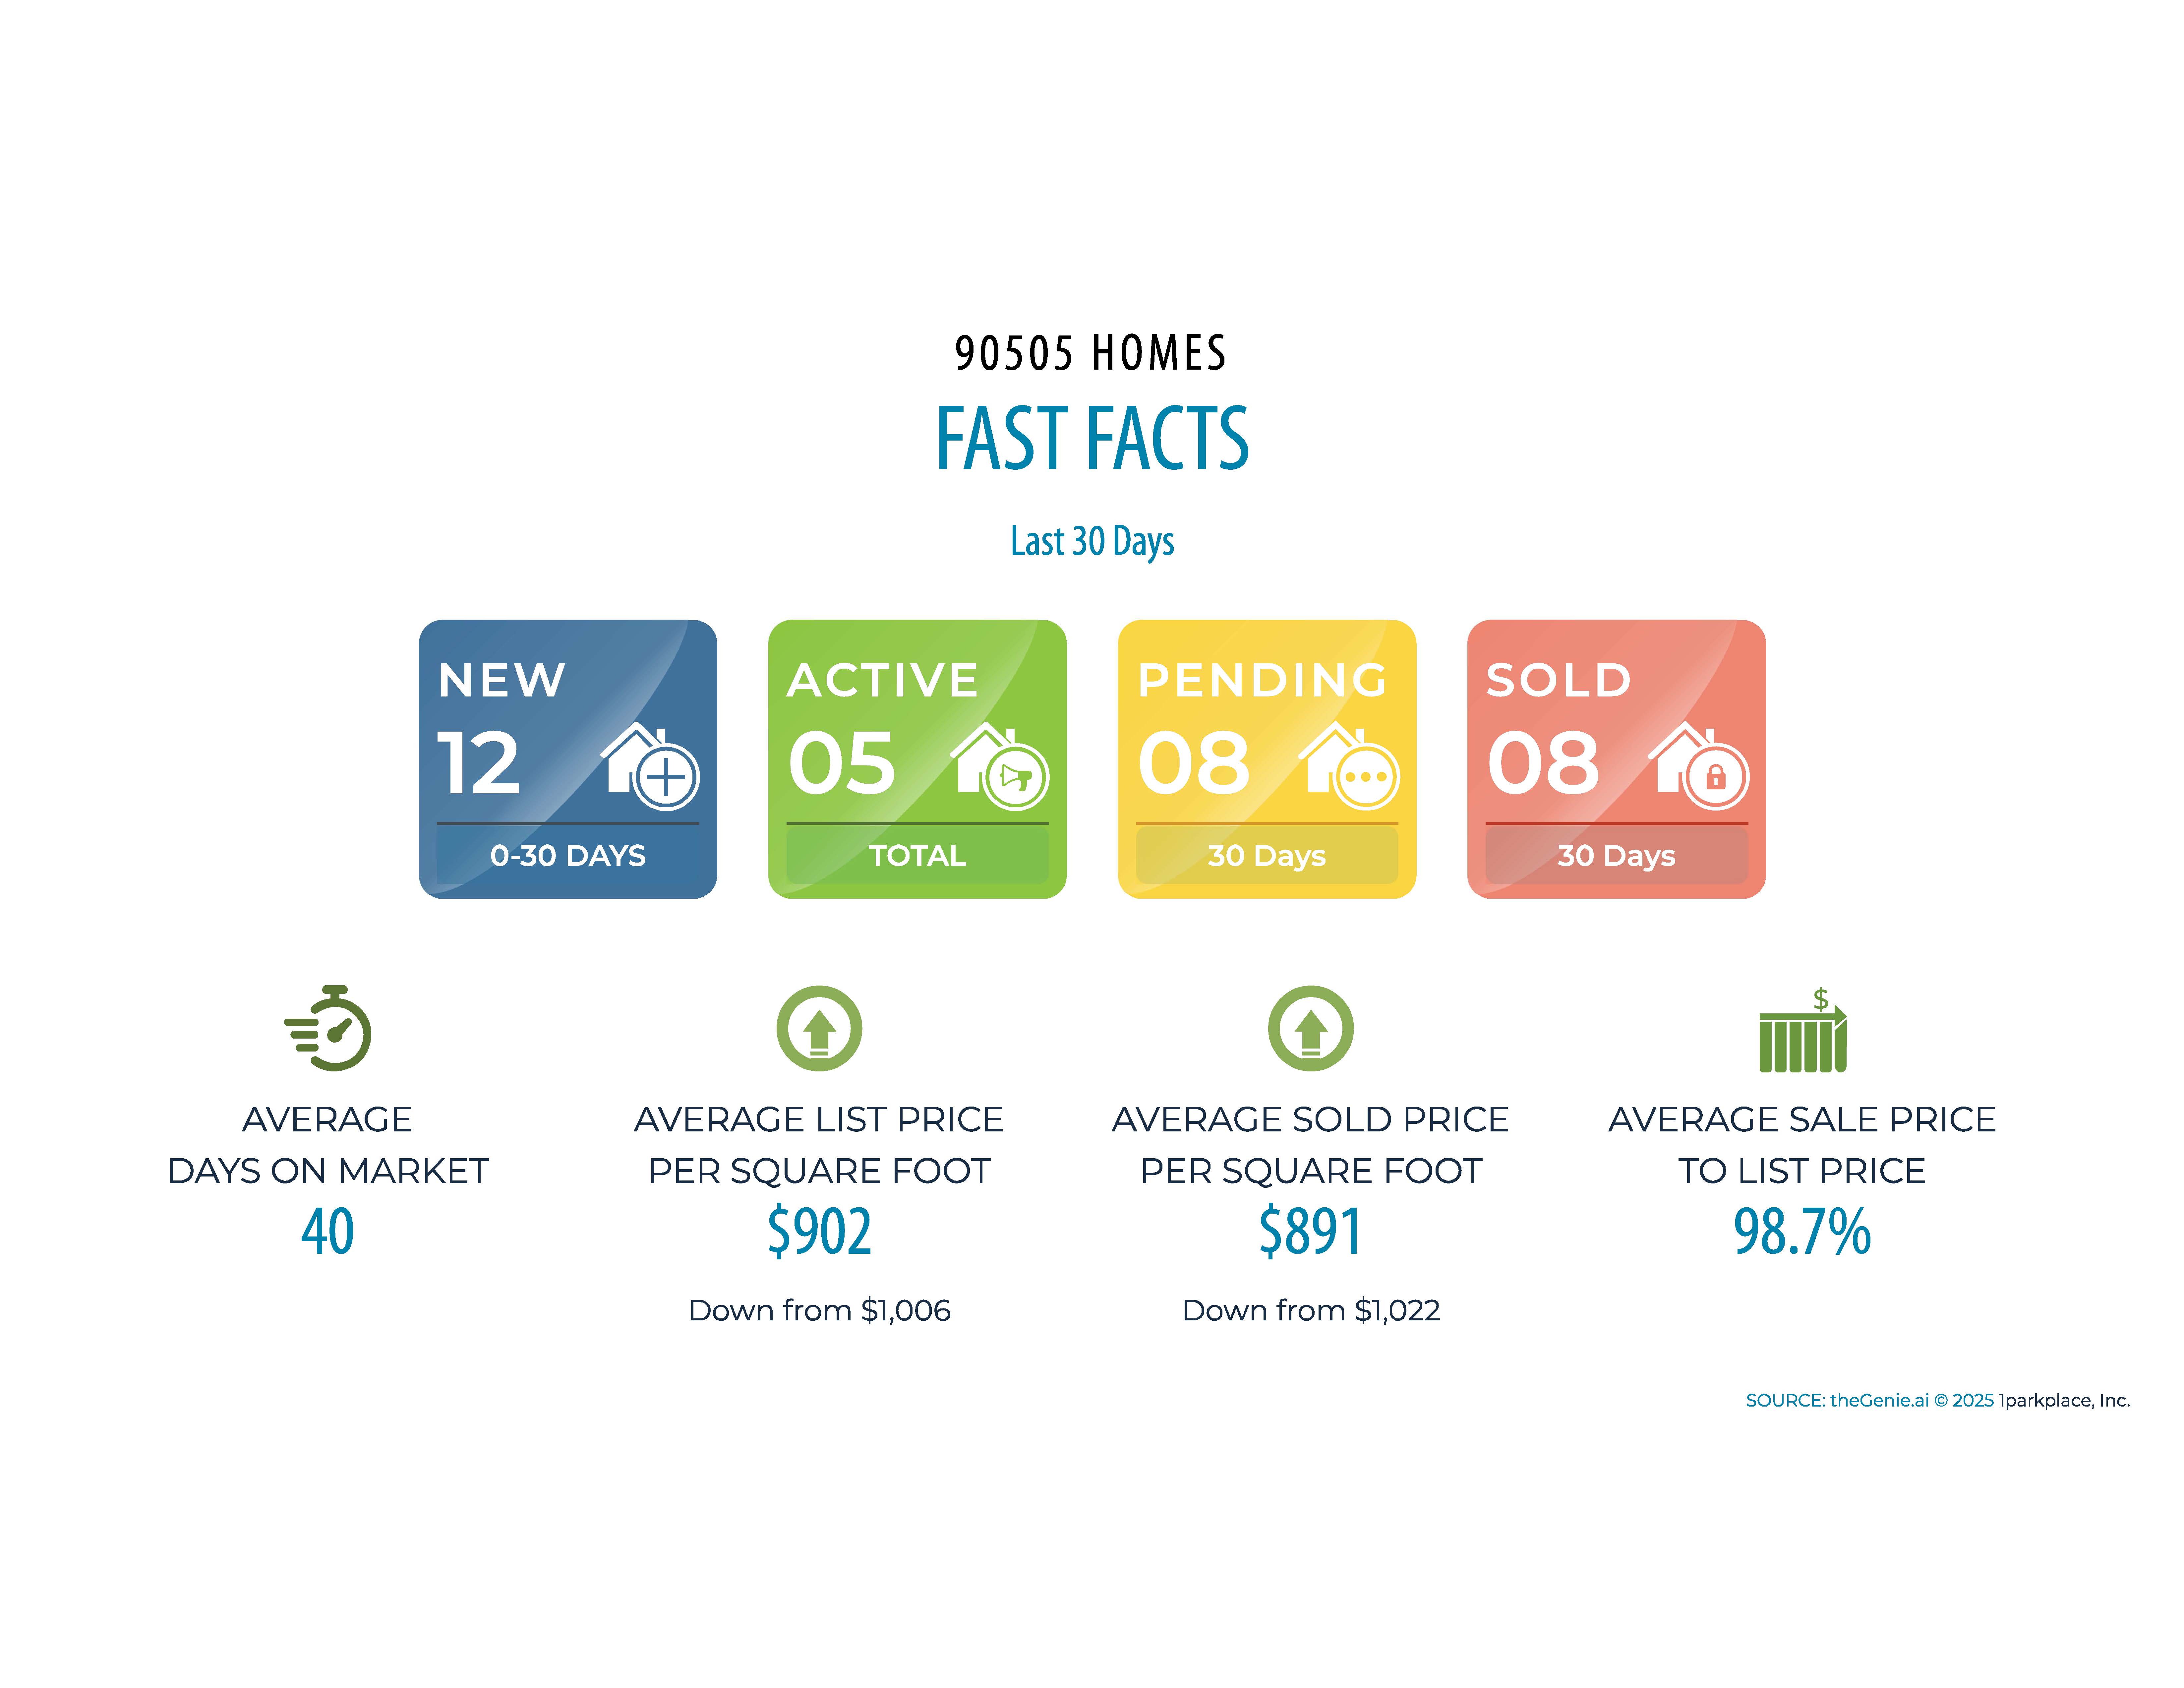
The slide above dives deeper into the activity within the 90505 real estate market over the last 30 days. It reports that 8 homes were sold, a 14% increase compared to the previous period, with 5 homes currently active on the market and 8 homes pending sale. Additional insights include the total number of homes in the area (7,803), the turnover rate of 1.2%, and the average days on market (40). The slide also notes that residents stay in their homes for an average of 17 years, highlighting the stability of this community. This is called a turnover rate. Areas with lower turnover rates generally help drive demand. Scarcity drives interest.
What Is a "Comp"?
The term "comp" is short for “comparable sale,” and it’s one of the most important tools in real estate pricing. A comp refers to a recently sold property that is similar in size, condition, location, and features to the home you’re buying or selling. Here’s why comps matter:
- For Buyers: Comps help you understand what similar homes in the area are selling for, so you can make a competitive and informed offer.
- For Sellers: Comps guide you in setting a realistic asking price that reflects the current market while maximizing your home's value.
- For Appraisers: Comps are used to establish the appraised value of a home, ensuring lenders and buyers have a clear picture of its worth.
Market Highlights for Torrance 90505:
- Median Sale Price: $1,353,375 (down 11.5% since December 2024)
- Highest Sale Price: $1,755,125 (sold on January 15, 2025)
- Average Sale Price: $1,359,734
This shift in pricing suggests potential buying opportunities and underscores the importance of watching market fluctuations closely.
LOCAL MARKET PERFORMANCE
In the last 30 days:
In the last 30 days:
- 8 Homes Sold (up 14% from the previous period)
- Active Listings: 5
- Pending Sales: 8
- Average Days on Market: 40